
Trying out Elastic Beats


I thought it was about time, as I had some to spare today, to have a play with one of the new feature of the Elastic family of products I have yet to try.
Beats is the platform for single-purpose data shippers. They install as lightweight agents and send data from hundreds or thousands of machines to Logstash or Elasticsearch.
I have used an ELK stack before but never for metrics, it always been for more traditional log files and tools such as Zabbix have been my goto for metrics.
Before going any further it should be pointed out that this is in no way a production configuration, there is no high availability, storage volumes used or any thought around security, it is just a proof of concept.
Launching an Elastic Stack
As I needed somewhere to send my metrics to I decided to use Docker Machine (Docker again, now there is a surprise) to launch three Docker hosts in DigitalOcean, configure a Swarm and then create an Elasticsearch & Kibana service.
To do this, I first launched a manager host;
docker-machine create \ --driver digitalocean \ --digitalocean-access-token your-do-token-goes-here \ --digitalocean-region lon1 \ --digitalocean-size 2gb \ managerThen two workers;
docker-machine create \    --driver digitalocean \    --digitalocean-access-token your-do-token-goes-here \    --digitalocean-region lon1 \    --digitalocean-size 2gb \    worker01
docker-machine create \    --driver digitalocean \    --digitalocean-access-token your-do-token-goes-here \    --digitalocean-region lon1 \    --digitalocean-size 2gb \    worker02
Once I had all three Docker hosts online I ran the following to make sure that the Elasticseach container would launch;
docker-machine ssh worker01 sudo sysctl -w vm.max_map_count=262144docker-machine ssh worker02 sudo sysctl -w vm.max_map_count=262144Notice that I only ran the commands on the two worker nodes, I am going to keep my Elastic stack on just these two hosts.
Now that my three Docker hosts are available and configured I created the Docker Swarm cluster by running the following commands;
docker $(docker-machine config manager) swarm init --advertise-addr $(docker-machine ip manager):2377 --listen-addr $(docker-machine ip manager):2377SWMTKN=$(docker $(docker-machine config manager) swarm join-token -q worker)docker $(docker-machine config worker01) swarm join $(docker-machine ip manager):2377 --token $SWMTKNdocker $(docker-machine config worker02) swarm join $(docker-machine ip manager):2377 --token $SWMTKN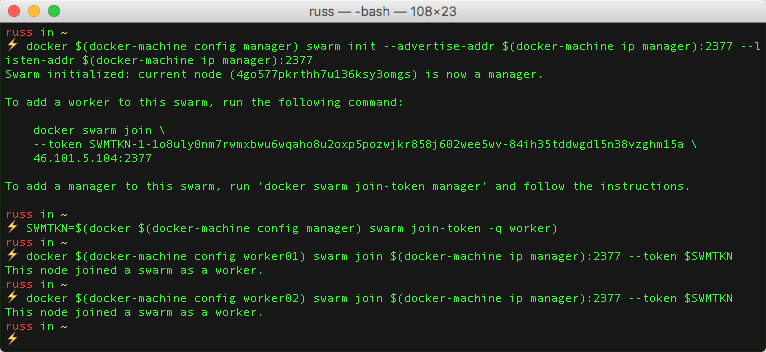
I checked that all three Docker hosts were correctly in the cluster;
docker $(docker-machine config manager) node ls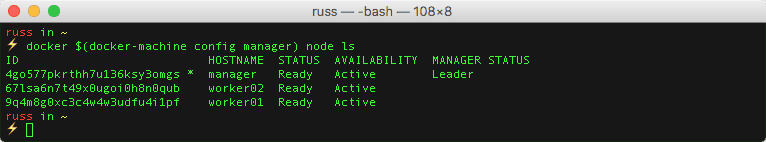
Everything was as expected, it was time to launch the Elasticsearch and Kibana services. I started by creating an overlay network called elk;
docker $(docker-machine config manager) network create --driver overlay elk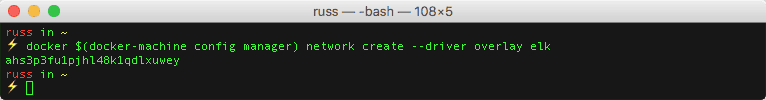
Then I created the Elasticsearch service;
docker $(docker-machine config manager) service create \ --name elasticsearch \ --network elk \ --publish 9200:9200 \ --constraint "node.role == worker" \ --env ES_JAVA_OPTS="-Xms512m -Xmx512m" \ elasticsearchFollowed by the Kibana service;
docker $(docker-machine config manager) service create \ --name kibana \ --network elk \ --publish 5601:5601 \ --constraint "node.role == worker" \ --env ELASTICSEARCH_URL=http://elasticsearch:9200 \ kibana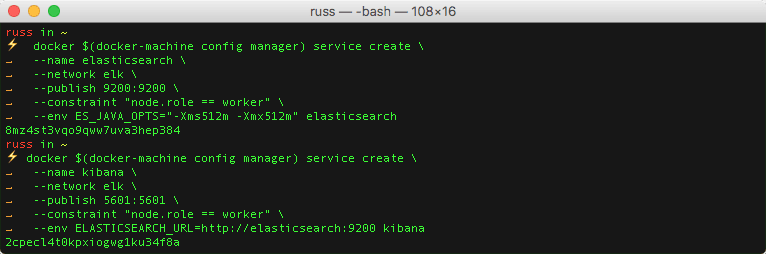
After a minute I checked that the two services were running as expected using;
docker $(docker-machine config manager) service ls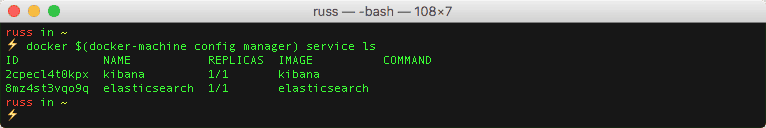
I now had my Elastic stack up and running.
Installing Metricbeats
Now that I had my three hosts running and an Elastic stack ready to ingest data I need to install some Beats on the host. Looking at the available Beats I decided to go with the Metricbeat as this covered all of the basics I wanted;
System-Level Monitoring, Simplified; Deploy Metricbeat on all your Linux, Windows, and Mac hosts, connect it to Elasticsearch and voila: you get system-level CPU usage, memory, file system, disk IO, and network IO statistics, as well as top-like statistics for every process running on your systems.
As Docker Machine provides an SSH command, I decided to continue to use that to install and configure the service. Before installing I grabbed the IP address of the Manager node so I could use it when configuring Metricbeat, to do this I ran the following;
SWMIP=$(docker-machine ip manager)I should be able to use $SWMIP where I need to need to use the IP address of a host within the Swarm Cluster. Remember, as I launched the Elastic stack as a service hosted on an overlay network I should be able to hit any of my three nodes to be routed to the correct container.
I started by installing Metricbeats on worker01, first of all by downloading and installing the deb package;
docker-machine ssh worker01 curl -L -O https://artifacts.elastic.co/downloads/beats/metricbeat/metricbeat-5.1.1-amd64.debdocker-machine ssh worker01 sudo dpkg -i metricbeat-5.1.1-amd64.debOnce I had installed the deb package I configured Elasticbeat by running the following command which overwrote the default configuration file;
docker-machine ssh worker01 bash -c "cat > /etc/metricbeat/metricbeat.yml << METRICBEAT_CONFIGmetricbeat.modules:- module: system metricsets: - cpu - load - core - diskio - filesystem - fsstat - memory - network - process enabled: true period: 10s processes: ['.*']- module: docker metricsets: - cpu - info - memory - network - diskio - container hosts: unix:///var/run/docker.sock enabled: true period: 10soutput.elasticsearch: hosts: ['$SWMIP:9200']METRICBEAT_CONFIG"The configuration file enables two Metricbeat modules;
- system; this is the default module which collects host metrics such as the ones listed under “metricsets”.
- docker; this is an experimental module which gathers metrics on both the Docker hosts and the containers running on them, notice that I have configured it to use the socket file rather connecting to the Docker API using a network socket.
Also, at the end of the configuration, we tell Metricbeat where our Elasticsearch container is accessible for it to send data.
Once the configuration file was in place I started the service by running;
docker-machine ssh worker01 sudo /etc/init.d/metricbeat start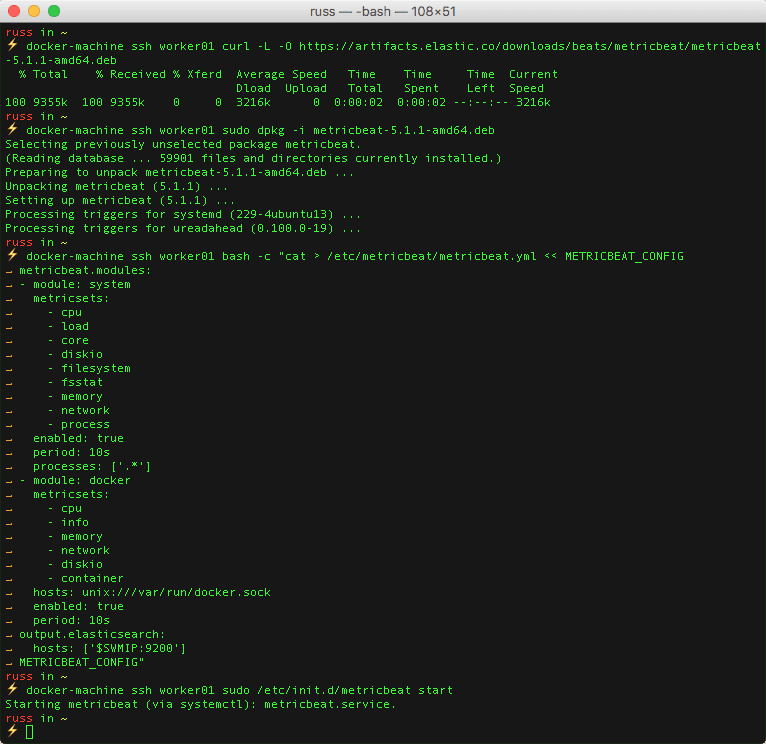
I then repeated the process on worker02 and manager by replacing worker01 in the docker-machine ssh commands.
Before I logging into Kibana there are two more things that I needed to do, first of all, import the Metricbeat template, to do this I ran;
docker-machine ssh manager curl -XPUT "http://$SWMIP:9200/_template/metricbeat" -d@/etc/metricbeat/metricbeat.template.jsonThen, I ran a script to import the pre-built Kibana Dashboards by running;
docker-machine ssh manager sudo /usr/share/metricbeat//scripts/import_dashboards -es http://$SWMIP:9200Viewing the Metrics Dashboard
Now that I had installed and configured Metricbeat on all three hosts and readied Elasticsearch and Kibana it was time to open the Kibana dashboard.
To do this, I ran the following command;
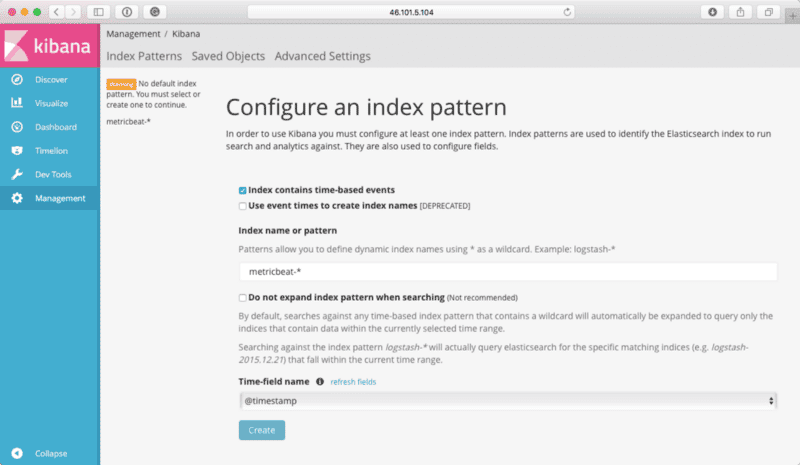
open http://$(docker-machine ip manager):5601Like all other Kibana installations, the first thing I needed to do was configure an index pattern, to do this I entered metricbeat-*and selected @timestampfrom the drop-down list;
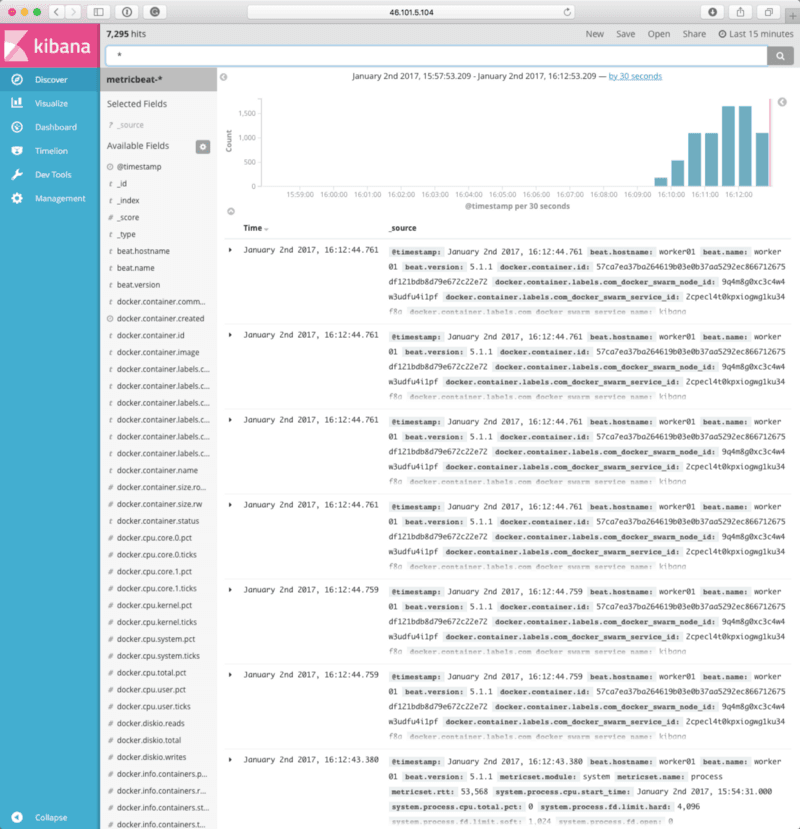
Once that index pattern had been configured clicking on Discover took me to the following view, as you can see, I was receiving metrics from my three hosts;
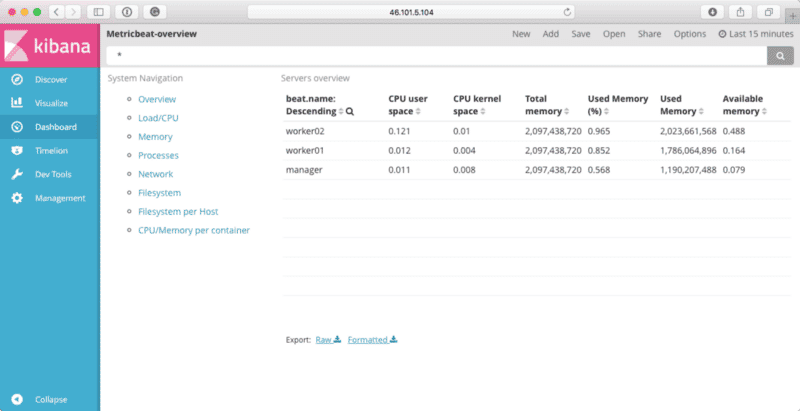
Clicking on Dashboard, and then selecting Metricbeat-overview gave me the following view;
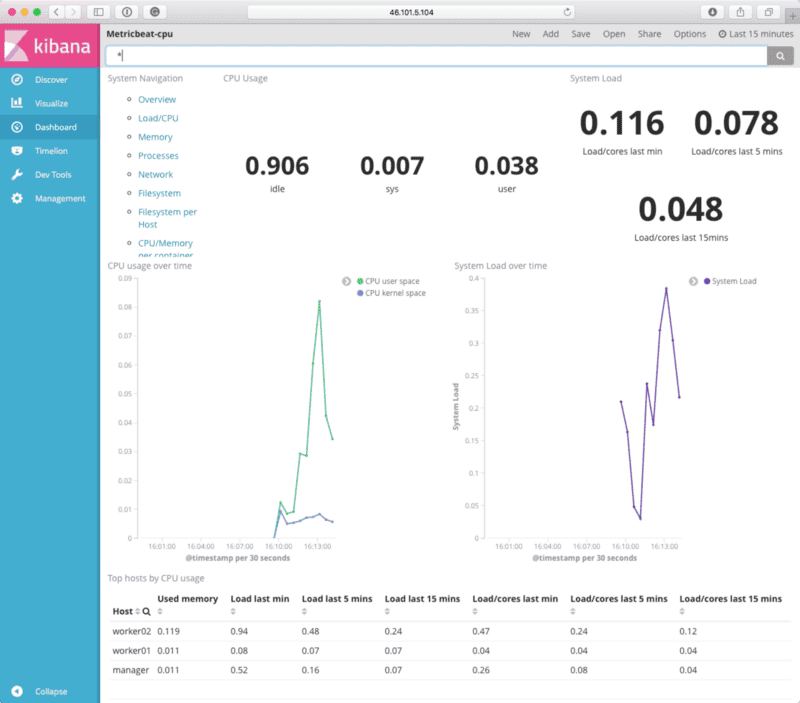
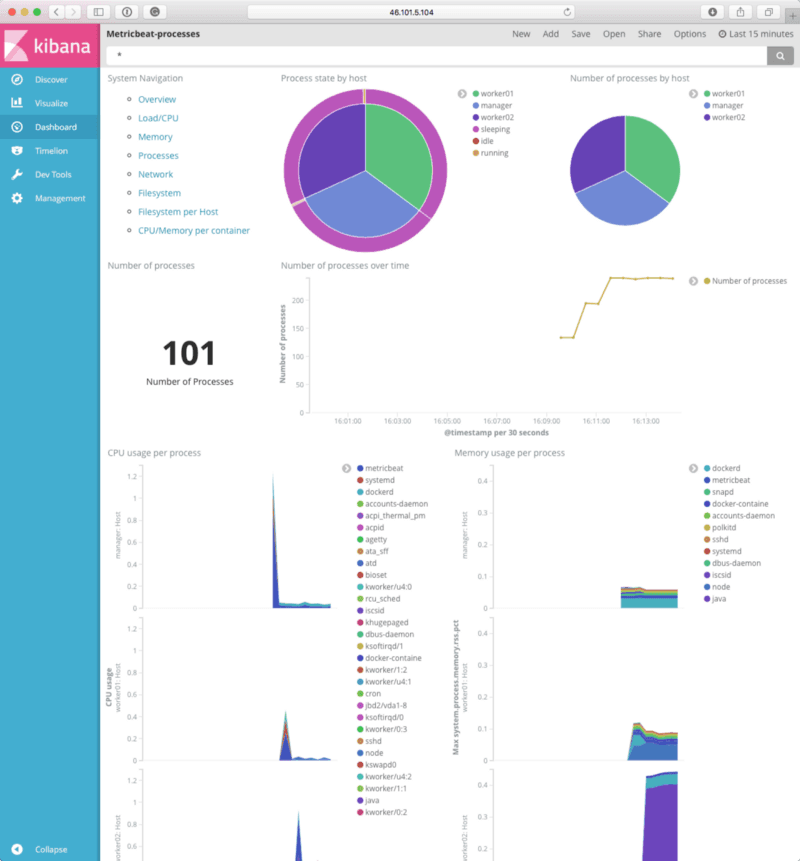
From there I clicked on Load/CPU and Processes gave me the following dashboards;
So far, so good. Before moving onto the Docker dashboards, I decided to launch a few more services. To do this, I ran the following;
docker $(docker-machine config manager) network create -d overlay clusternetworkdocker $(docker-machine config manager) service create \ --name cluster\ --replicas 3 \ --publish 80:80/tcp \ --network clusternetwork \ russmckendrick/clusterThis created a service which launched three basic containers using the image from russmckendrick/cluster and then made them available on port 80 on all three hosts.
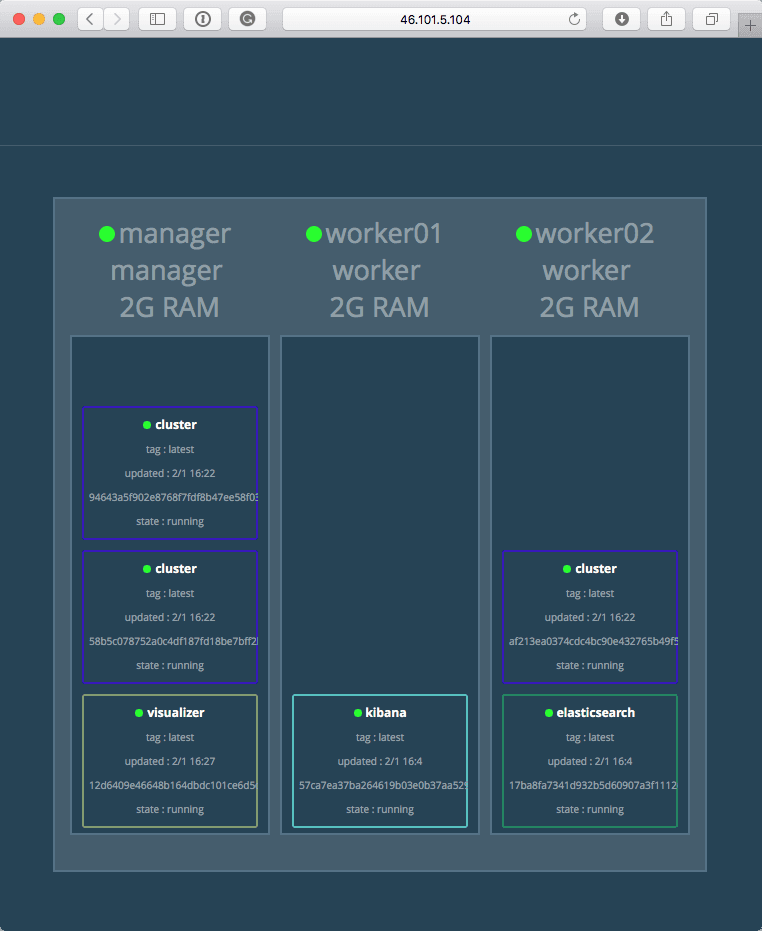
Then I launched a service using manomarks/visualizer, this gives you a visual representation of your Docker Swarm cluster. To this I ran;
docker $(docker-machine config manager) service create \ --name viz \ --publish 8080:8080 \ --constraint node.role==manager \ --mount type=bind,src=/var/run/docker.sock,dst=/var/run/docker.sock \ manomarks/visualizer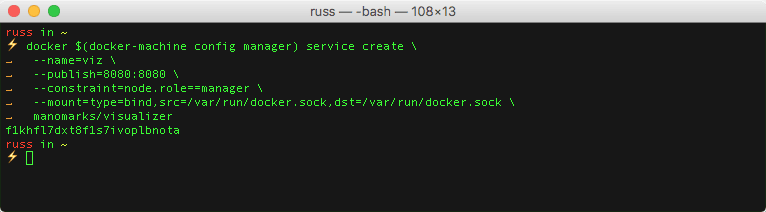
Running the following showed me my cluster
open http://$(docker-machine ip manager)/Then running;
open http://$(docker-machine ip manager):8080Opened my browsers and showed me how my Swarm cluster was organised;
Going back to Kibana, I selected the Metricbeat Docker dashboard and was greeted by the following;
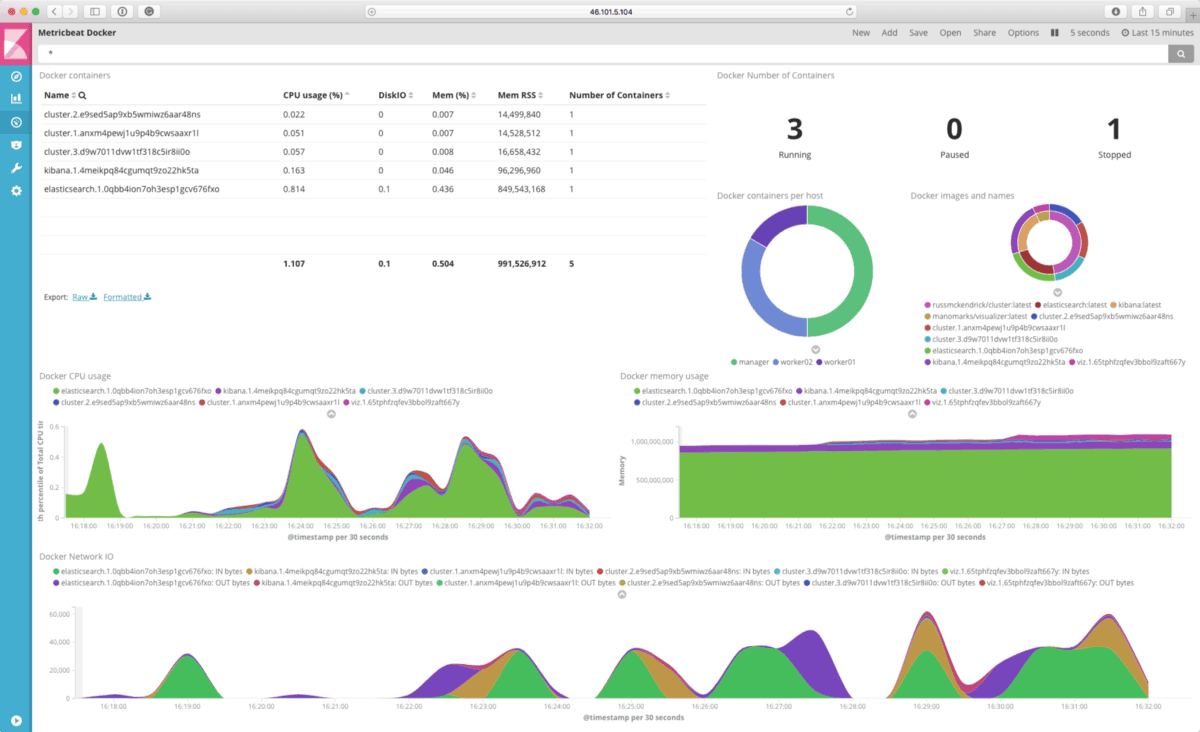
The dashboard is exactly what I was expecting to see, selecting the container from the list on the top left shows just the metrics for the selected container. At this point, my time ran out, so I tore down the cluster by running;
docker-machine rm manager worker01 worker02After dipping my toe in the water I think it is something I am going to be looking into more, there are plenty of other Beats available;
The following talk from OSDC 2016 gives a good idea about the sort of things you can use Beats for;
Related Posts
Portainer, a UI for Docker
Discover Portainer: Simplify Docker management (150k+ pulls). Open-source tool streamlines container deployment, management & monitoring for devs & DevOps.

Tracking costs in Terraform using Infracost
Track Terraform costs with Infracost. Install, register, and monitor changes in your Azure DevOps pipeline efficiently.
Shopping for Containers
Explore the Docker Store, your one-stop marketplace for Docker-related content. From Docker EE to plugins and containers, find both free and paid offerings.

Comments